Canvas sections in D365 Configurable Business Documents
Embedding static sections of a fixed width and length into configurable Business documents in Excel seems to be hard to impossible, but it is not. An example can be an American pre-printed Cheque or the notorious French Bill of exchange at the end of the invoice. The section may not span 2 pages, i.e. it should be kept together to be torn off or scanned by the bank OCR system. This cannot be achieved by merging cells but with floating graphical elements only. Follow the below advice how to make it:
- Better use Excel. The mapping of an Excel file to an Electronic Reporting format configuration is based on the named ranges (name manager), a mapping of a named Text box in a drawing is also possible. It is not necessary to attach an XML schema to the Excel file, the design of an Excel report is a simple WYSIWYG exercise.
- You cannot use the Configurable business documents UI, because the changes needed are intricate and can hardly be made in the online Office 365. You have to locate the exact format in Electronic reporting (here: Sales invoice (Excel) (FR)), open and save the attachment with the template on your computer, amend it, upload it as an attachment and reassign to the root node in the format Designer.
- Figure out the exact width of the paper by printing the document. Check at which column the page boundary begins (here: M-N).
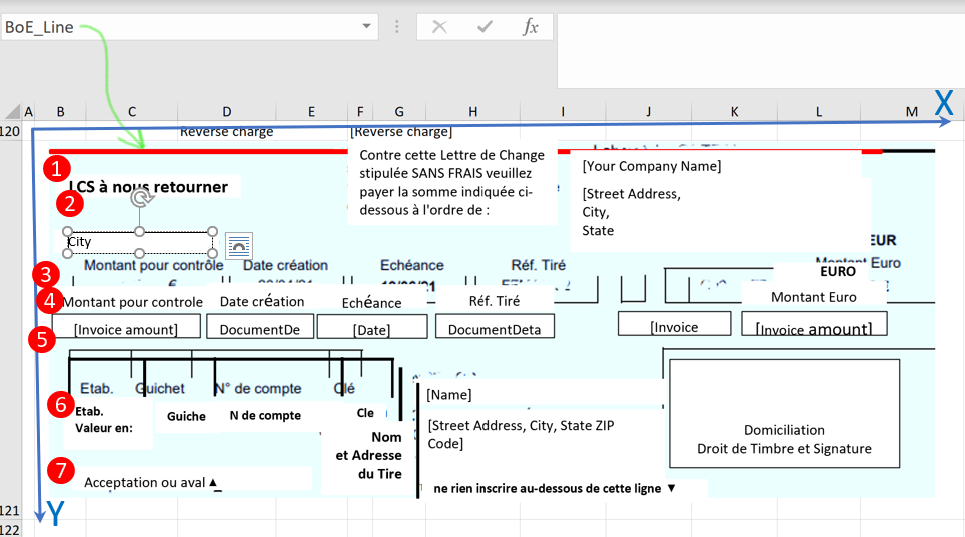
- Capture a raster image of the section you have to embed and paste it as a template into your document to position the vector elements over it nicely. Send it to the background and resize carefully to match the full page width (here in the background, cyan stained).
- The drawing elements get anchored by Excel to the adjacent cell, and to maintain the relative positions they should be floating inside of a large merged cell of the size of the whole section (here: $B$121:$M$121). The outer boundaries of the elements shall not cross the boundaries of this mother sell. Make the row a named range which will be holding all the boxes and images (here: BoE for the bill of exchange).
- The Electronic Reporting may only work properly with Text boxes and Images. Everything must be rendered with text boxes.
- To address and populate the elements in the Electronic Reporting format definition, they must be named ranges* in Excel (here for the red line: BoE_Line).
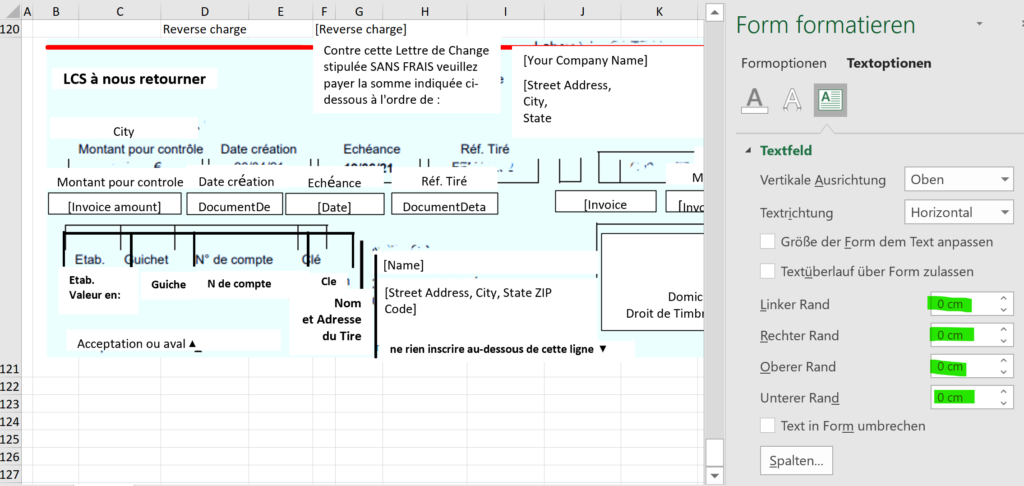
* Not really a range but a named/renamed element of a drawing. The ER engine is going to multiply them – in theory – and a BoE_Line element becomes BoE_Line1 etc. in the final output.  The Electronic Reporting cannot currently place circles, lines or any other geometric form properly. The little triangles in this example have been drawn with Unicode symbols like “∇”. If you need to draw a line, it must be an empty Text box with a height of around 0,03 cm and an opaque line around of the given thickness divided by 2. The inner boundaries of the text must be all zero, otherwise the ER will corrupt the width, the position and the line type and make it disappear:
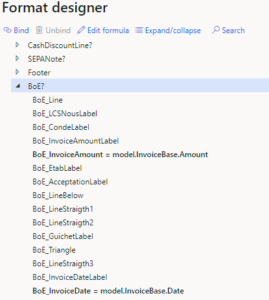
- Every element (including the “lines”!) must be explicitly listed (listed, not necessarily mapped!) in the format definition as a cell or range, otherwise the graphical object remains linked to the absolute number of the adjacent cell (e.g. B121) and starts floating all around, appearing in the middle of the invoice when you print it.
 The objects must be in the proper order, or the ER Designer is going to warn you that “The range BoE_Line must be preceded by the range XXX“. The sorting order is a bit special. If the cells are sorted by {ROW, COLUMN}, the drawing objects are apparently sorted by the cartesian coordinates {X;Y} of the upper left corner, from left to right, then from the up to the bottom (which is a theoretical aspect, since it is hard to place the elements at exactly the same X coordinate by drag and drop only). See the above enumeration 1-7, the upper line starting the leftmost.
- Test and print your report with a proforma document often. If you don’t know how to test an ER configuration in a Draft status, here is the sacred answer: Electronic Reporting (ER) Cookbook 2: new tips from the kitchen.
- The raster image shall be removed in the end, of course, it is too cheap a solution for the static texts and lines.
Conclusion
To avoid all this mess, you may try to convince the customer that negotiable instruments from the XVIII-XIX centuries may become obsolete in the XXI (you know: the wire payments, SEPA, blockchains and Co…) Good luck with that.
Electronic reporting blog series
Further reading:
Customer invoice falsifier for D365 for Finance
Amend GDPdU = GoBD = FEC
Z4-Meldung an Bundesbank
Enumerate lines in Configurable Business Documents
D365 Electronic Reporting: JOIN records in pairs
Electronic Reporting (ER) Cookbook 4: References in a model
Electronic reporting for data migration
Electronic Reporting (ER) Cookbook 3: Working with dates
Electronic Reporting (ER) Cookbook 2: new tips from the kitchen
Electronic Reporting (ER) Cookbook


2 Comments
Hi, thanks for these cookbooks as they are really helpful.
I do have a query that I hope you can help me with, some of the Excel invoice formats have ranges that expand when data is present in them or hide when there is no data (eg Sales order charges on the SalesInvoice). I’m struggling to see how this works and also if this can be replicated in MS Word templates ?
Hello, if you open the Mapping tab, you are going to see a question mark (?) next to the node. It means the range is a dynamic one and gets activated if a boolean condition is met, typically something like @.Text <> “” meaning the context should not be empty, otherwise the range must disappear. The condition is visible in the bottom right corner of the screen. I assume Word formats use a similar technique.